
TokenTrace
Local-first AI CLI usage analytics.
- Platform
- Node.js 20.9.0+, macOS, Linux, Windows
- Pricing
- Free (MIT)
TokenTrace
Developer Tools
Overview
- Version
- 0.21.2
- Downloads
- 8.4k total
- Updated
- 26 Jun 2026
- Category
- Developer Tools / local analytics
- Runtime
- Node.js 20.9.0+
- OS
- macOS, Linux, Windows
- Surfaces
- 11
- Price
- Free (MIT)
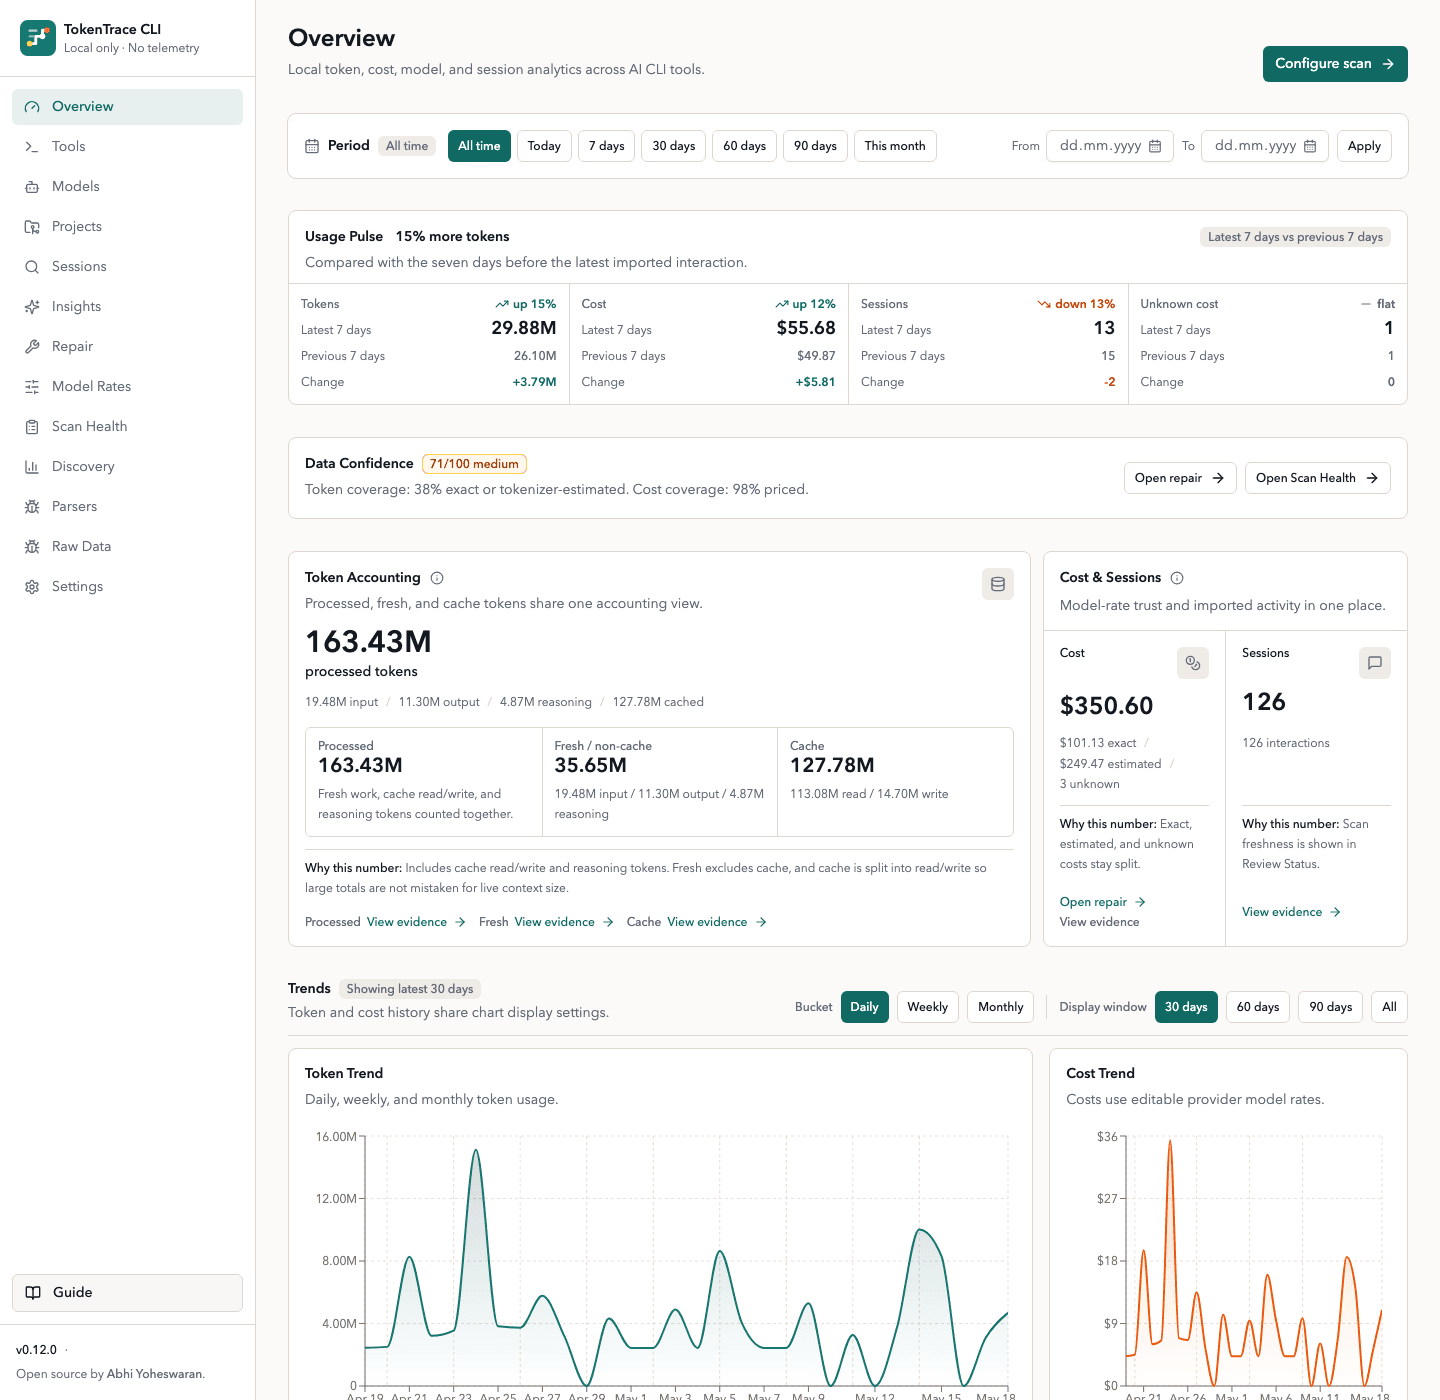
An AI CLI doing real work writes usage records to disk as it goes. TokenTrace reads those local artifacts from Claude Code, Codex, OpenAI, and other tools, normalizes the token usage, estimates missing counts when it has to, and shows cost, models, projects, sessions, and parser evidence in a local dashboard.
Everything lives in one local SQLite database. Every total traces back to the sessions and source files that produced it, every record carries a Data Confidence score, and you can export any total as an Evidence Pack. No cloud account, no telemetry, no proxying.
TokenTrace is one of two related developer-tools projects here. ProjScan gives coding agents structural facts about your codebase; TokenTrace shows you, after the fact, what those agents and their CLIs cost. Ingestion reads only the local filesystem on purpose: desktop scraping, browser extensions, traffic interception, and cloud telemetry change the trust profile, so they stay off the roadmap.
Features
What it does well.
Dashboard
02- Evidence-first overview
- Usage Pulse, token accounting, Model Rates, and Trend charts, where every total links back to the records behind it.
- Performance and mobile
- Streaming render, tuned SQLite, a prepared-statement cache, and hash-cached rescans, plus mobile card layouts for Repair and Model Rates.
Ingestion
02- Scan Health
- Files checked, parser warnings, cost coverage, scan scheduling, supply-chain IOC checks, and per-parser overrides, all in one view.
- Repair workflow
- Unknown-cost rows grouped by cause, each with the next best repair beside its evidence and a before/after delta before you commit.
Evidence & Reports
02- Evidence Packs
- Export the trail behind any total as JSON or Markdown, with no raw prompts by default, safe to share.
- Saved reports
- Reusable report templates stored locally, replayed on demand or exported as JSON, Markdown, or a standalone XSS-safe HTML file.
Agents & MCP
03- Local intelligence
- Anomaly detection, structured SQL query answers, and an unknown-cost auto-classifier, all running on local SQLite with no AI tokens.
- MCP entry point
tokentrace mcpstarts a local stdio MCP server with an in-process, read-only tool surface;run_scanneeds explicit human confirmation.- Agent-ready entry points
- A read-only discovery manifest over CLI and HTTP, plus agent-adoption docs and an llms.txt index, so any agent finds the surface.
Trust & Privacy
02- Local sources and trust
- Reads JSON, JSONL, SQLite, and Cursor exports the AI CLIs already write on disk, tagging every record with a Data Confidence score.
- Privacy
- No telemetry, no proxy, no cloud account; local files never leave the machine, and the one network call refreshes public Model Rates.
See it in action
A closer look.
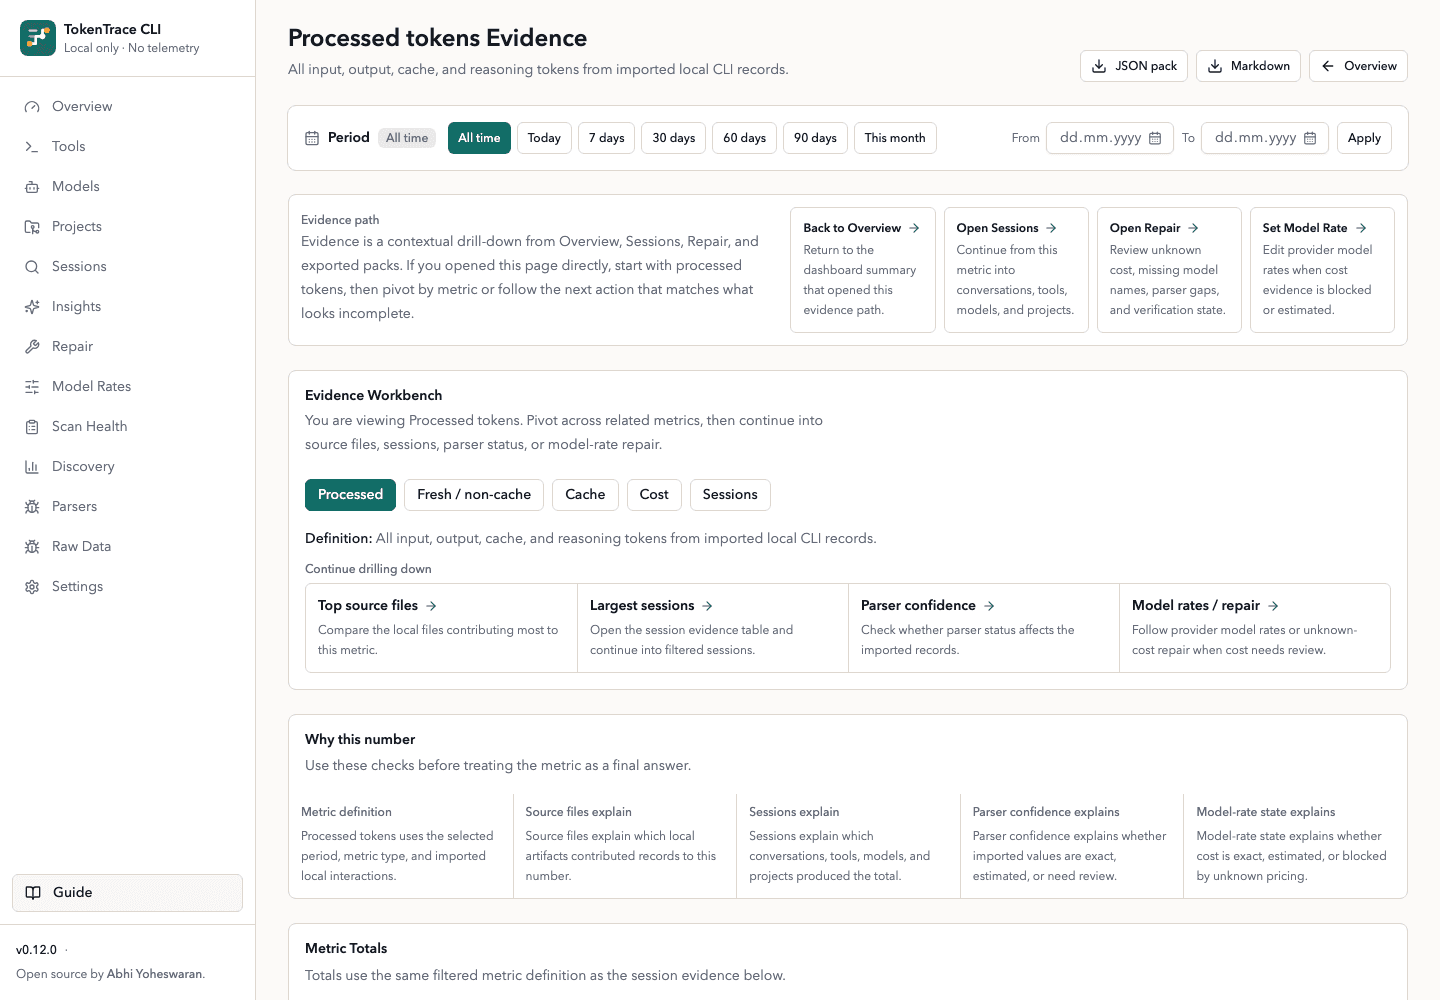
Evidence trail behind any total
Trace a processed-tokens total back to its sessions, source files, Parsers, and Model Rates. tokentrace evidence --json prints the same trail.
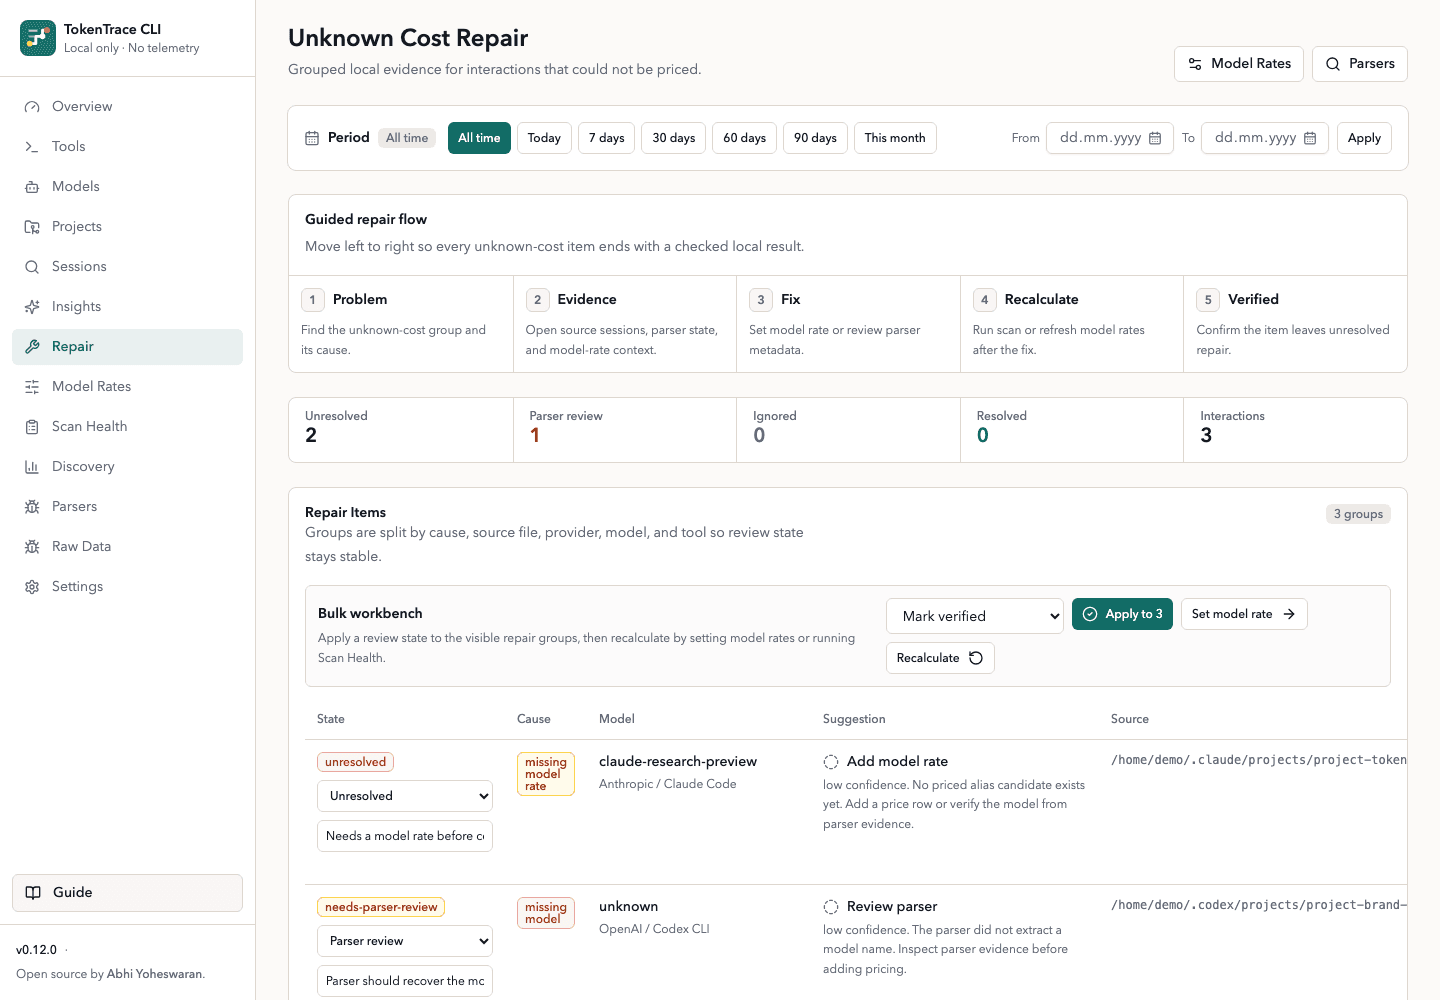
Unknown-cost rows, grouped by cause
Each group carries alias hints, Parser review links, and a Model Rate follow-up, with a before/after delta before you commit.
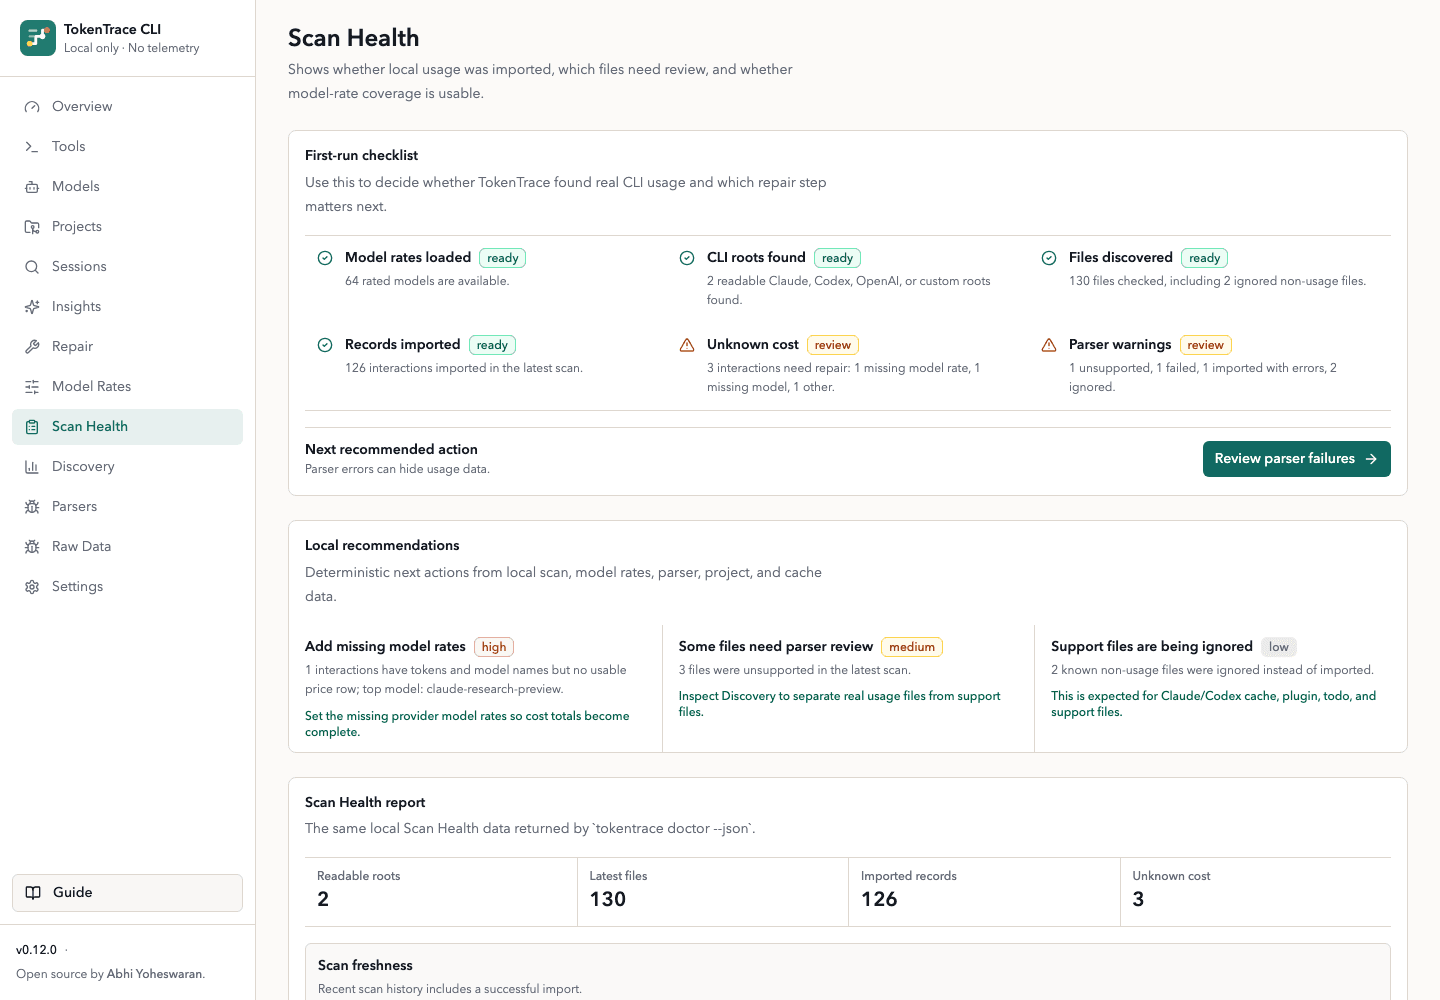
Scan Health and the Parser Trust Report
Files checked, Parser warnings, cost coverage, scan scheduling, and supply-chain IOC checks, all in one view.
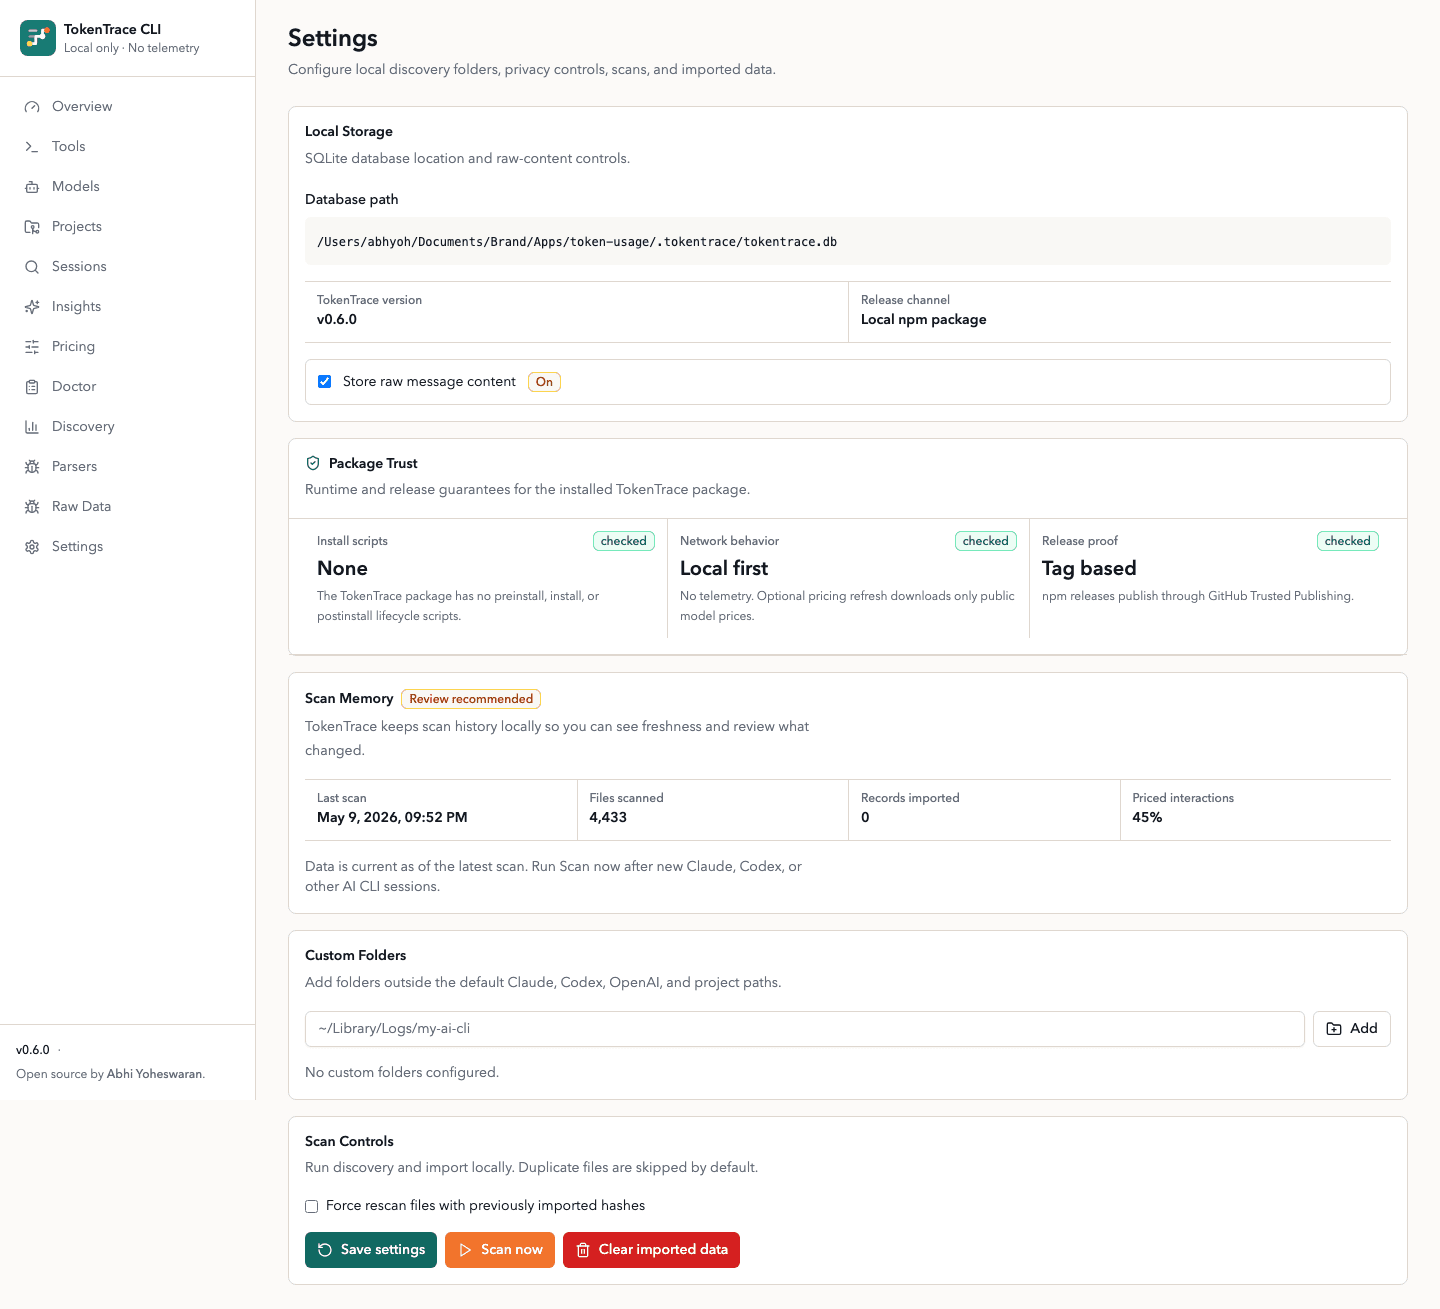
The trust contract, shown in-app
The same install-script, network, and provenance guarantees, visible inside the running app at Settings, Package trust.
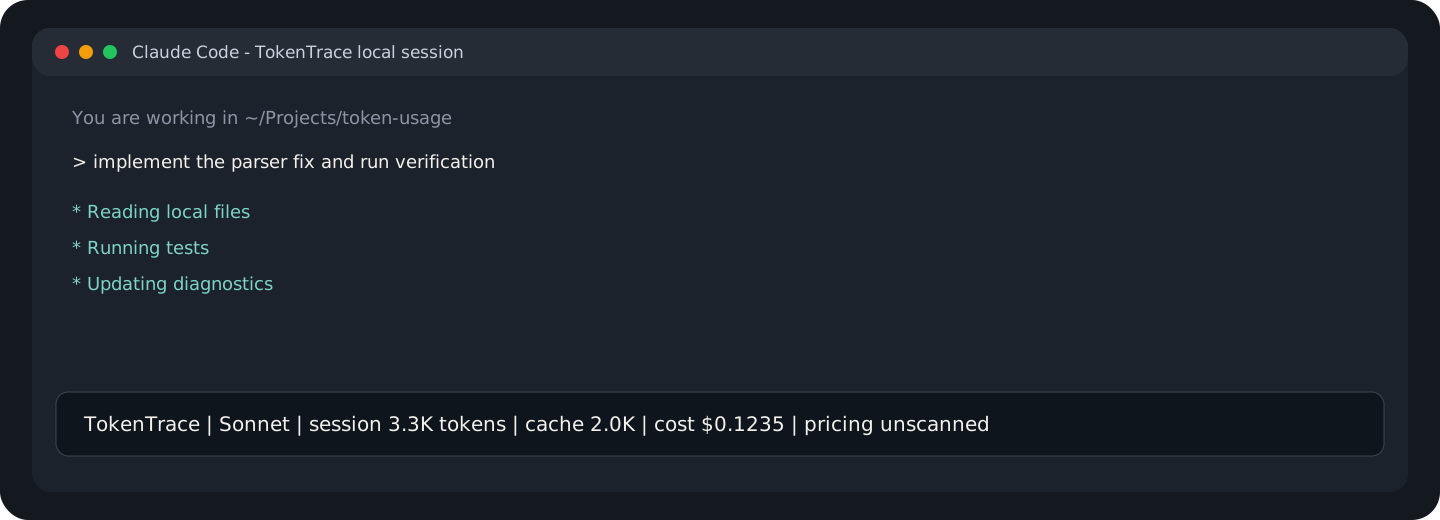
A live status line for Claude Code
Session tokens, cache, cost, and Model Rate state at the bottom of the session. It separates live context, what Claude is carrying now, from cumulative processed and cache usage, so you stop misreading tokens used as tokens in context.
Release notes
Shipped in 0.19.2.
An engineering hardening release: faster agent tool calls, one shared report engine, and a bigger test safety net behind every change.
- Faster MCP tool calls
- MCP tools now run in-process instead of spawning a CLI subprocess per call. Agent tool calls come back faster and fail less.
- One report engine
- The dashboard, CLI, and MCP server now share a single report engine, with stricter compile-time checks and a type-checked CLI wrapper, so every surface reports the same numbers.
- Bigger test safety net
- 59 new integration tests now cover the HTTP API surface, and every change runs through a coverage-gated CI pipeline. The release also hardens CSV export headers, fixes a settings-page crash after a failed scan, and sharpens MCP error reporting.
Stable surface
What npm install ships.
The trust contract behind the version pill: privacy, package guarantees, runtime, and what the one network call does.
- Local files stay local
- TokenTrace reads files the AI CLIs already write on your disk. No scraping, no extensions, no traffic interception, no proxy, no MITM, and TokenTrace skips raw prompt and response bodies by default.
- No telemetry, no accounts
- No usage telemetry, no analytics ping, no accounts. The one optional outbound call refreshes public Model Rate data so the local cost estimate stays accurate. TokenTrace never bills you.
- No install scripts
- npm install tokentrace runs zero TokenTrace code. The package has no preinstall, install, or postinstall hooks.
- npm provenance
- Every release ships an npm provenance attestation, so anyone can verify on npm that the published package matches the public source repo.
- Readable source
- The published package ships readable application source and the compiled CLI runtime, not generated route bundles. Anyone can read what runs.
- Runtime
- Node.js 20.9.0+ for the dashboard and CLI, on macOS, Linux, and Windows. Each record carries a Data Confidence label (exact, tokenizer estimate, or simple estimate), so aggregates split back into measured versus estimated portions.
From npx to status line.
Run it without installing, wire the MCP server, or add a live status line to Claude Code.
Run without installing
Start an MCP server for agents
Inspect Scan Health and repairs
Add the Claude Code status line
More from the studio
ProjScan
ProjScan tells reviewers when to bootstrap, prove, or stop. Review Gate returns one decision; bootstrap is explicit. Local proof, no code upload.
View
AgentLoopKit
The local control plane for low-token, verifiable agent loops. It owns scope, gates, and completion decisions, with a token receipt on every step.
View
AgentFlight
agentflight guard watches local trust while your coding agent works; agentflight finish writes the Review Passport that proves the result.
View